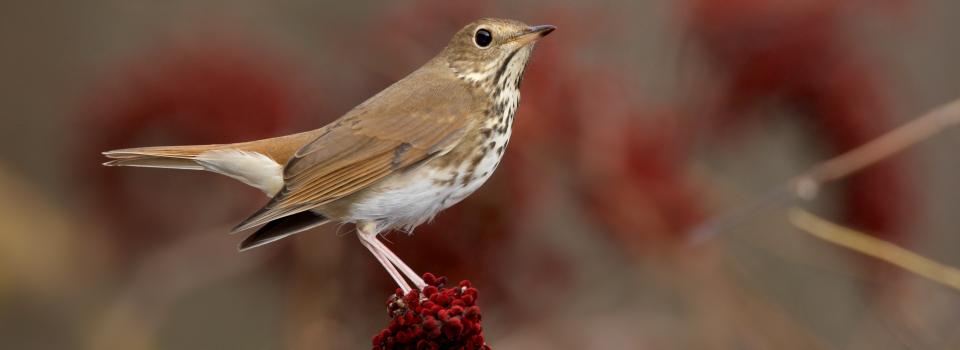
Hermit Thrush
Photo by: Robert Royse
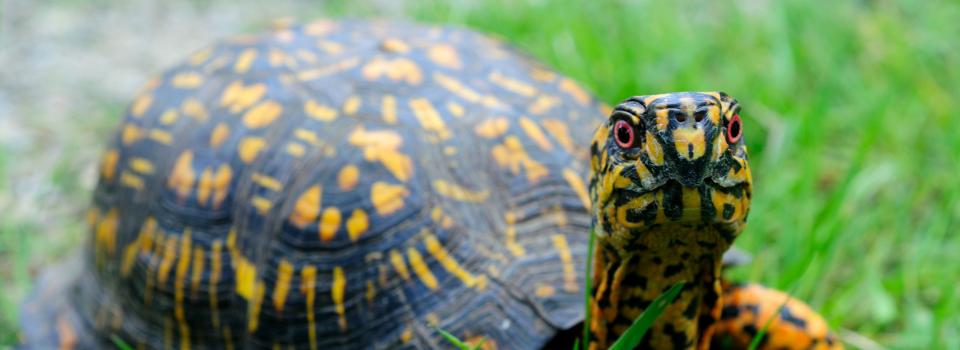
Box Turtle
Photo by: Jonathan Mays
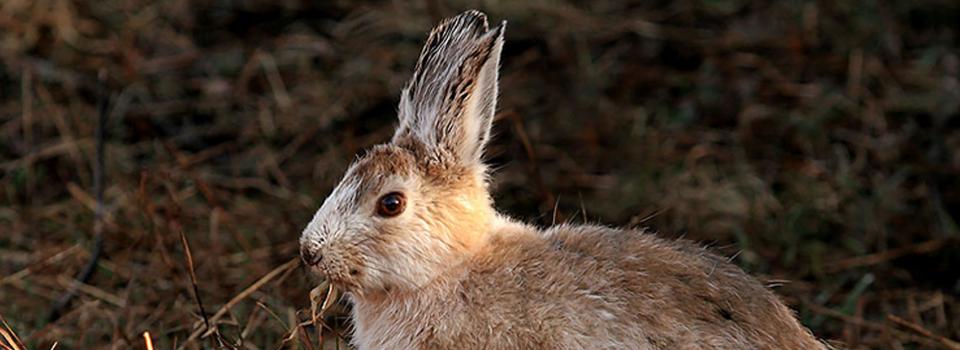
Snowshoe Hare
Photo by: Mike Hodgson
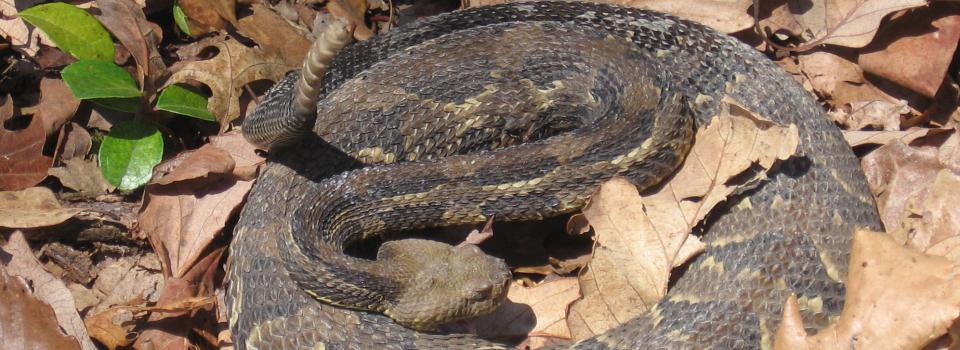
Timber Rattlesnake
Photo by: Kelly Wiley
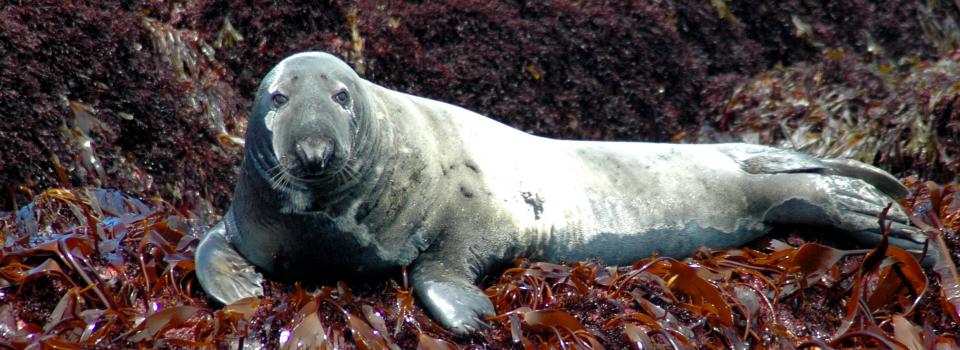
Gray Seal
Photo by: Jonathan Mays
Fulfilling the objective to “produce a map of wildlife habitats/ecological systems for the Northeast”, The Nature Conservancy’s Eastern Conservation Science office, with funding from the Northeast Association of Fish and Wildlife Agencies, is pleased to release the Northeast Terrestrial Ecosystem and Habitat Map. The map is a 30 meter grid that portrays upland and wetland wildlife habitats and ecological systems for the Northeast, including all 13 states from Maine to Virginia, west to New York, Pennsylvania and West Virginia. The ecological systems represented in the map are mosaics of plant community types that tend to co-occur within landscapes with similar ecological processes, substrates, and/or environmental gradients, in a pattern that repeats itself across landscapes
This mapping project was undertaken in 2008 with the support of the Northeast Association of Fish Wildlife Agencies. Development of a consistent habitat classification and map was seen by many Northeastern biologists and managers as the most critical initiative for habitat-based conservation efforts. The map aims to: provide a standardized and consistent habitat and ecosystem classification at multiple scales across states; facilitate interstate communication about habitats; offer managers a tool for understanding regional biodiversity patterns; allow for more effective and efficient habitat conservation across the region, including the prioritization of habitat conservation activities.
The project benefited from the efforts of over 40 scientists, and we are especially grateful to the 13 State Natural Heritage programs and the USDA-FS Forest Inventory and Analysis program who collectively contributed over 71,000 data points confirming the locations of upland and wetland communities. Without this information the map could not have been created. Scroll down for a list of contributors.
(Courtesy of The Nature Conservancy)
To view the map, click on the link below or go the project website.
![]()
© 2020 A Wildlife Management Institute Project